Line Plot with JavaScript - Plotly.js
Graph line plots with plotly.js. Plotly is Free software under the MIT license.
Plotly works even if you miss a couple of data points. For example, if you have temperature for all days but Tuesday.
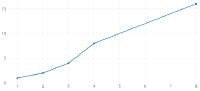
Live Demo
This demo is created by running JavaScript in your browser. If you can't see it, check out the screenshot, or jump right into code.
Complete Web Page
<!doctype html>
<html>
	<head>
		<title>Hello Plotly.js - TeroKarvinen.com</title>
	</head>
	<body>
		<h1>Hello Plotly.js - TeroKarvinen.com</h1>
		<div id="terosPlot"></div>
		<script src="https://cdn.plot.ly/plotly-latest.min.js"></script>
		<script>
			Plotly.newPlot(
				'terosPlot',
				[{x: [0, 1, 2, 5, 7], y: [1, 2, 4, 8, 16]}],
				{}
			);
		</script>
	</body>
</html>
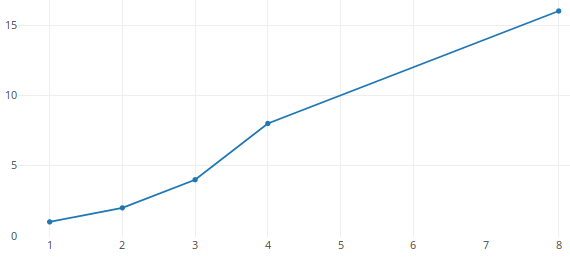
Screenshot
If you're learning JavaScript with JavaScript disabled, you can still enjoy this screenshot of the end result.
See also
This revisited and updated article is based on an earlier one: Simple Line Graph with Plotly.js