Wireshark - Getting Started
Wireshark is the leading network sniffer and analyzer.
In this article, you'll learn to install Wireshark on Debian Linux.
You'll capture traffic and view statistics. Finally, you'll use display filters to extract DNS name queries and HTTP web surfing.
Working in Linux
We'll use Debian in this article. It's probably easy to adapt this to other Debian-based distros, such as Kali, Ubuntu and Raspbian. If you don't have Debian yet, you can install Debian on virtual machine.
This article assumes that you can use Linux on command line.
Install Wireshark
Install wireshark, make it work non-root (wireshark group can sniff).
$ sudo apt-get update
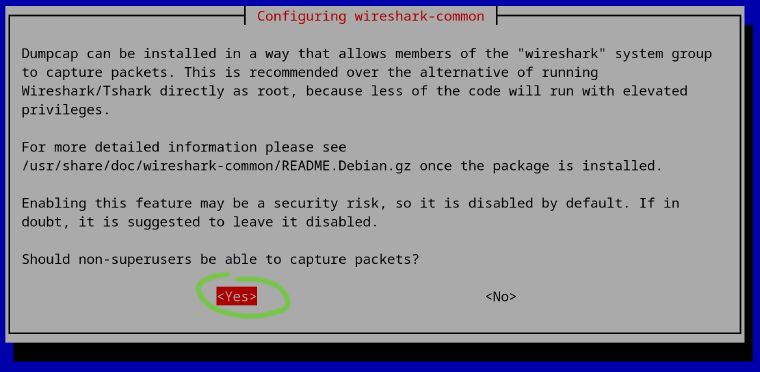
$ sudo apt-get install wireshark
"Should non-superusers be able to capture packets?" Yes.
Tip: If web surfing and apt-get update complain about certificate or signature dates, probably your clock is wrong. Set the current time with 'sudo timedatectl set-time "2025-03-28 15:42"'
Let's add ourself to the group of people who can sniff:
$ whoami
tero
$ sudo adduser tero wireshark	# use your own name here
Group is updated when you log off and on again.
Being lazy, I start a new shell with the new group. To see the new group, 'wireshark' must be launched from within this shell. Of course, you can just log off and on for it work everywhere.
$ newgrp wireshark
$ wireshark
Wireshark GUI (graphical user interface) opens.
Sniff a little
Select what you want to sniff. If you would like to see something, pick an interface that has traffic.
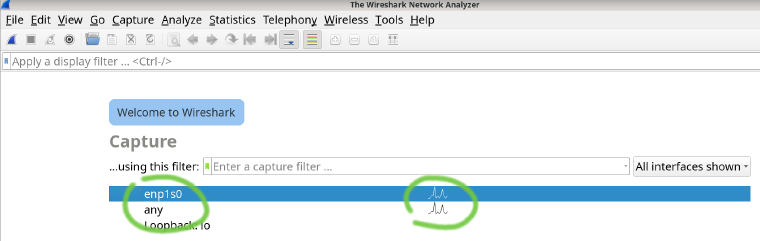 Your network interfaces are listed here. They are like network cards, except some interfaces can be virtual. Loopback adapter is not a physical extension card. (I have a short article about Network Interface Names on Linux.
You can use "any" to capture on all interfaces. It's a convenient way to see that you can capture something.
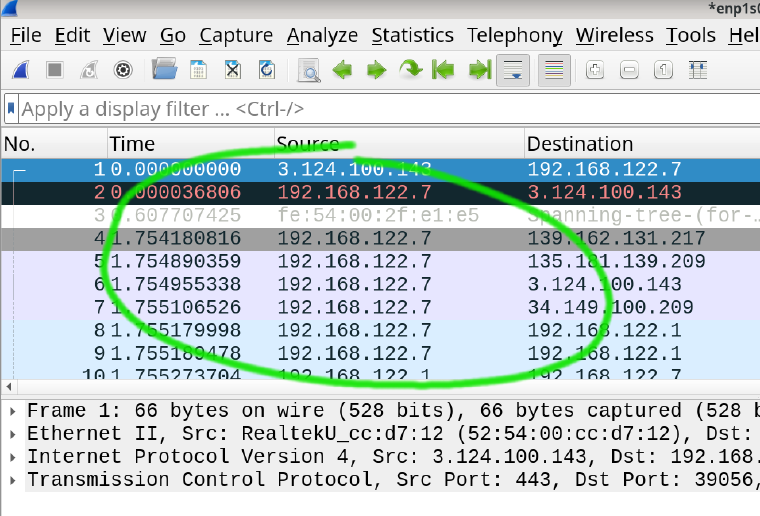
Can you see some packets appear? Well done, you're capturing network traffic!
Usually, we capture as little as possible. Less stuff to wade through. So let's stop the previous capture. Click "Stop", the red box, top left on the toolbar.
You can choose a new interface to capture with menu Capture: Options...
Click "Start", the blue shark fin, top left on the toolbar.
Troubleshooting tips: No packets captured
If you don't see any traffic: Try surfing the web.
Still no traffic?
Maybe you're not in the group "wireshark"? You can see it with the command 'groups'. If you have added yourself to the group, try logging out and back in.
Saving and loading packet captures (pcap)
You can save your capture:
- File: Save as
- Dialog: Save Capture File As
- File name: "teros-example.pcap"
- Save as: "Wireshark/tcpdump/... - pcap"
Load a capture file:
- File: Open
- Select your file
Loaded file can be analyzed just like real time sniffing.
Viewing your capture
Statistics
Statistics menu allows a quick overview of your capture
- Endpoints: list of hosts in the capture
- I/O Graphs: when did the traffic happen over time? How long time were packets captured?
- Procol hierarchy: is this HTTPS or telnet? Display filters affect what's shown here. To see "Protocol hierarchy" for the whole capture, clear your display filters first.
Display filters
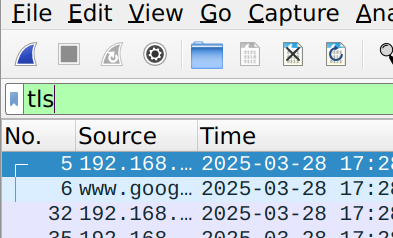
You can filter the capture with display filters. Just type them into the white box top-middle.
- dns - Queries for DNS, the domain name system.
- tls - connections encrypted with TLS, transport layer security. This includes most of web surfing.
- http - Unencrypted HTTP connections. Less common than tls.
- tcp.port == 443 - Filter with port (both to and from).
- ip.addr == 192.168.122.7 - Either to or from internet protocol address.
- frame contains "terokarvinen.com" - Search for any string anywhere, similar to 'ngrep'.
You can also right click on packet list and "Apply as Filter..."
Follow TCP Stream
To read a whole conversation as text, right click and "Follow: TCP Stream". This is useful with unencrypted connections.
Who would use 'telnet' anymore? An attacker might use unencrypted TCP socket connection (like meterpreter reverse TCP) or netcat.
Adminstrivia
Updated: Added a display filter.