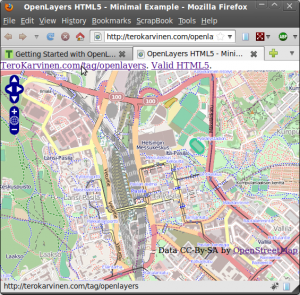
 Add a free, interactive map on your homepage. Just plain HTML5 and JavaScript, no special server needed. Live demo with source.
No API keys needed. And if you really like it, you can later download planet vector data for free!
Prequisites: HTML5, JavaScript
Source Code Explained
<!doctype html>
The new HTML5 Doctype. Some older examples won’t work with HTML5. Especially, you must make sure that #map div is larger than 0x0.
<meta charset="utf-8" />
Always define the charset in document. UTF-8 is the new black.
<div id="map" style="top: 0; left: 0; bottom: 0; right: 0; position: fixed;">
Fill parent with just CSS. This is the preferred method.
<script src="http://openlayers.org/api/OpenLayers.js"></script>
For good performance, JavaScript should be last, just before /body. OpenLayers.js should be called before your own code using it. To speed things up, you could also copy OpenLayers.js to your server.
map = new OpenLayers.Map("map");
OpenLayers.Map(divName) is the main container for everything. It includes layers, all the vectors and point of interest (POI) markers.
map.addLayer(new OpenLayers.Layer.OSM());
OpenLayers.Layer.OSM() is the standard OpenStreetMap Mapnik layer. This is what you normally want.
var lonLat = new OpenLayers.LonLat(24.9342, 60.2017)
	.transform(
	   new OpenLayers.Projection("EPSG:4326"), // from WGS 1984
	   map.getProjectionObject() // to Spherical Mercator
	);
You can get coordinates from OpenStreetMap.org regular web interface. Just navigate to your point of interest, using search if needed. Then click “Permalink” on bottom right. The URL shows latitude and longitude. Be careful not to mix lat and lon: they have different order in the URL and in OpenLayers.LonLat() constructor.
map.setCenter (lonLat, 14);
Center the map on the point you created. Zoom to 14, about 10 meters per pixel or 1:35.000.
Live demo: OpenLayers, OpenStreetMap, valid HTML5.