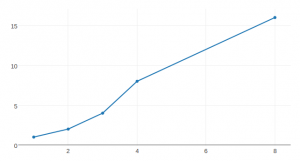
 Draw a simple line graph with Plotly.js.
With Plotly, drawing a line graph is just a single line of code.
All in One HTML page
<!doctype html>
<html>
	<head>
		<title>Hello Plotly.js - TeroKarvinen.com</title>
	</head>
	<body>
		<h1>Hello Plotly.js - TeroKarvinen.com</h1>
		<div id="terosPlot"></div>
		<script src="https://cdn.plot.ly/plotly-latest.min.js"></script>
		<script>
			Plotly.newPlot(
				'terosPlot',
				[{x: [1, 2, 3, 4, 8], y: [1, 2, 4, 8, 16]}],
				{}
			);
		</script>
	</body>
</html>
The Page Explained
You need
- Empty div for the plot. Feel free to choose any id, I used “terosPlot”.
- Plotly.js library. I used one from a content delivery network (someone elses server), but you can also host it yourself.
- One liner JavaScript call to draw the plot: Plotly.newPlot(). For clarity, I formated it on multiple lines.
See also
Standalone Hello Plotly.js example with locally hosted Plotly.js library.
Homepage of Plotly.js
GitHub repo for Plotly.js
MIT license of Plotly.js
<!doctype html>
<html>
<head>
<title>Hello Plotly.js – TeroKarvinen.com</title>
</head>
<body>
<h1>Hello Plotly.js – TeroKarvinen.com</h1>
<div id=”terosPlot”></div>
<script src=”js/plotly.min.js”></script>
<script>
Plotly.newPlot(
‘terosPlot’,
[{x: [1, 2, 3, 4, 8], y: [1, 2, 4, 8, 16]}],
{}
);
</script>
</body>
</html>